How Regional Climate Data Shapes Real-Time Odds Adjustments on Licensed US Platforms
Otto Hayes · Jun 26, 2026
How Regional Climate Data Shapes Real-Time Odds Adjustments on Licensed US Platforms
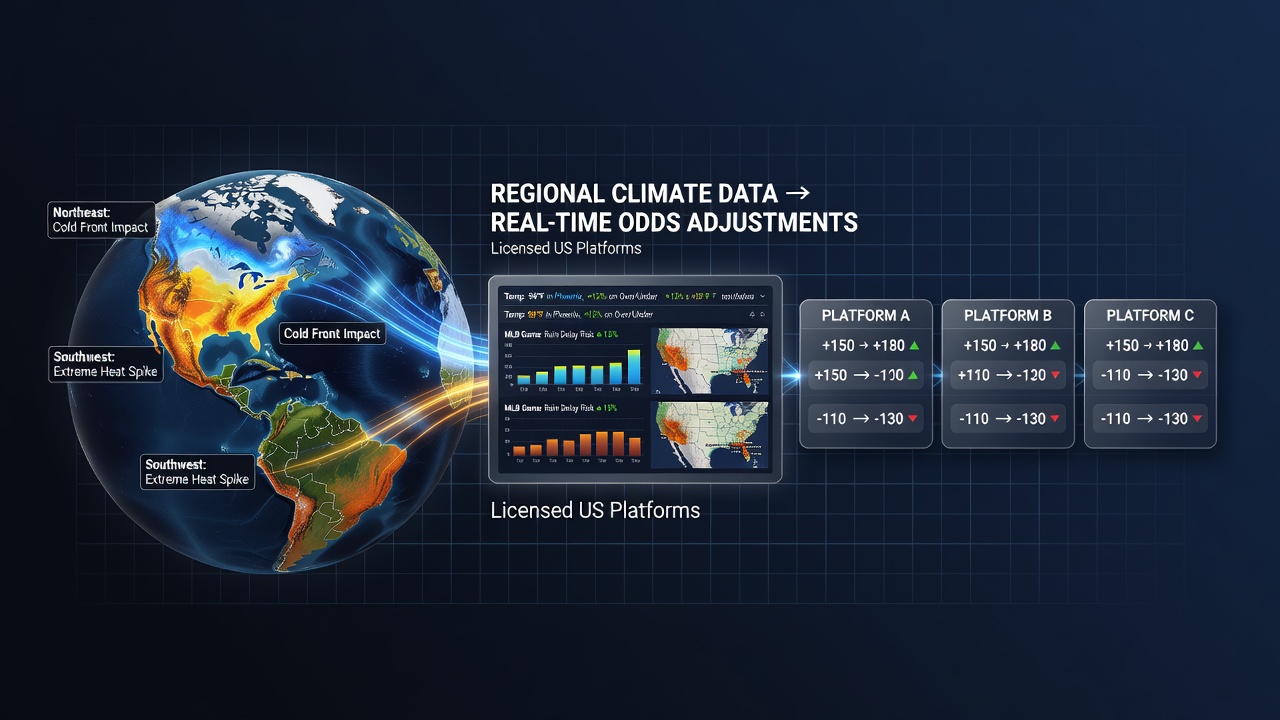
Regional climate data feeds directly into the algorithms that licensed US sportsbooks use to tweak betting lines during live events, and this process has become more precise as operators integrate detailed weather models from multiple sources. Operators in states such as New Jersey, Pennsylvania, and Michigan pull temperature, precipitation, wind speed, and humidity readings that vary sharply by geography, then adjust odds for outdoor sports where those variables alter player performance and game totals.
Integration of Climate Feeds into Betting Systems
Platforms connect to public and proprietary weather APIs that update every few minutes, allowing oddsmakers to recalculate probabilities while games are underway. A sudden temperature drop in the Great Lakes region during an NFL contest, for instance, can shift totals markets because colder air tends to reduce passing efficiency and increase the value of running plays. Data from the National Oceanic and Atmospheric Administration supplies baseline forecasts, yet operators layer on hyper-local sensors at stadiums to capture micro-climate effects that national models miss.
Algorithms weigh these inputs against historical performance metrics for each team and venue, creating a dynamic line that moves in small increments rather than large jumps. In June 2026, as the MLB season reached its midpoint, several platforms reported more frequent adjustments during day games in humid southeastern markets where afternoon thunderstorms frequently interrupt play adn alter scoring patterns.
Regional Differences Across Licensed Markets
Climate impacts differ markedly between arid western venues and humid eastern ones, which forces operators to maintain separate risk models for each state jurisdiction. Arizona and Nevada sportsbooks track low-humidity conditions that favor pitchers in baseball, while Florida and Texas platforms monitor rapid humidity spikes that increase fatigue for position players later in games. These distinctions appear in the frequency of line movements, with desert markets showing steadier totals and coastal states experiencing quicker shifts when radar detects incoming precipitation.
Wind patterns add another layer, particularly for sports like golf and outdoor football where sustained gusts above fifteen miles per hour can change yardage expectations. Operators serving the Midwest adjust for lake-effect wind bursts that arrive without much warning, whereas platforms in the Pacific Northwest focus on steady drizzle that affects field conditions and ball grip over longer periods.
Real-Time Adjustment Mechanisms
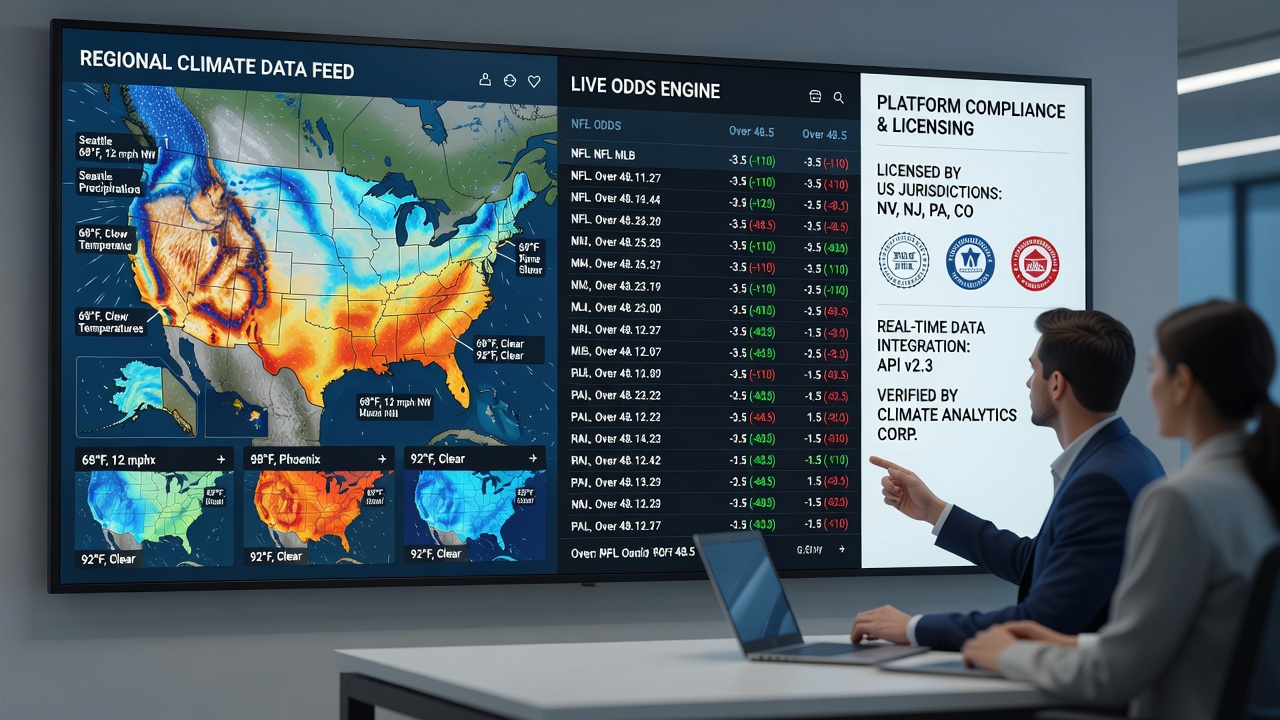
Automated systems flag when climate thresholds are crossed, triggering human review or direct line updates depending on the operator's risk protocols. A wind shift detected thirty minutes before kickoff might prompt a modest change in point-spread odds, while an unexpected downpour can move over-under totals more aggressively because historical data shows scoring drops in wet conditions. Licensed platforms must document these adjustments to comply with state gaming regulations that require transparency around any factor influencing odds.
Third-party data partnerships supply refined models that combine satellite imagery with ground sensors, giving operators an edge in predicting how regional patterns will evolve during the event window. One study released by researchers at the University of Oklahoma examined ten years of college football data and found measurable correlations between regional humidity levels and rushing yardage totals, which several sportsbooks now incorporate into their live models.
Impact on Specific Sports and Seasons
Baseball presents the most frequent adjustments because games occur daily across varied climates, and pitching staffs react differently to heat and humidity. Summer months in June 2026 highlighted this pattern as operators in humid markets adjusted strikeout props and run totals more often than those in drier regions. Football, by contrast, sees concentrated adjustments during the fall season when cold fronts move across the central and eastern United States, prompting rapid changes to player prop markets for quarterbacks and wide receivers.
Those who manage risk at licensed platforms note that climate data also influences in-game betting volume, because bettors react to visible weather developments on broadcast feeds and place wagers accordingly. This feedback loop requires systems to recalculate odds even faster to maintain balanced books across jurisdictions.
Regulatory and Technical Considerations
State regulators require that any data source used for odds adjustments meet audit standards, which has led operators to favor established climate providers over unverified feeds. Multi-state operators maintain unified platforms that apply different climate weightings depending on the jurisdiction where each user account is registered, ensuring compliance while still capturing regional effects accurately.
Technical infrastructure must handle simultaneous updates from dozens of games across time zones, with climate variables ranked by their projected impact on the specific sport and market type. This ranking process relies on machine-learning models trained on past seasons, allowing the system to prioritize the most relevant regional signals in real time.
Conclusion
Regional climate data has become a core input for real-time odds management on licensed US platforms, shaping adjustments across multiple sports and state markets. Operators combine national forecasts with venue-specific readings to produce lines that reflect current conditions, and this practice continues to evolve as data resolution improves. In June 2026 the pattern remains consistent, with platforms in distinct climate zones applying tailored models that respond to local weather developments as they occur during live events.